11 4/24 | Lab X: MLE

## Packages You May Need
library(knitr)
library(haven)  ## install.packages("haven")
library(car)    ## install.packages("car")
library(AER)    ## install.packages("AER")
library(Hmisc)  ## use the describe command
library(mfx)    ## for marginal effects calculation
library(tidyverse)

## Loading Data
dta <- read_dta("Data/Ch12_Lab_Titanic.dta")
11.1 Take a look at the dataset. Once you have an idea what the variables are, use a LPM to estimate the effect of passenger class on survival.
## Creating Variables
dta$pclass_2 <- (dta$pclass == 2)
dta$pclass_3 <- (dta$pclass == 3)

## LPM Model
lpm_1 <- lm(survived ~ pclass_2 + pclass_3, data = dta)
summary(lpm_1)
##
## Call:
## lm(formula = survived ~ pclass_2 + pclass_3, data = dta)
##
## Residuals:
## Min 1Q Median 3Q Max
## -0.6192 -0.2553 -0.2553 0.3808 0.7447
##
## Coefficients:
## Estimate Std. Error t value Pr(>|t|)
## (Intercept) 0.61920 0.02571 24.084 < 2e-16 ***
## pclass_2TRUE -0.18959 0.03784 -5.011 6.17e-07 ***
## pclass_3TRUE -0.36391 0.03102 -11.732 < 2e-16 ***
## ---
## Signif. codes: 0 '***' 0.001 '**' 0.01 '*' 0.05 '.' 0.1 ' ' 1
##
## Residual standard error: 0.4621 on 1306 degrees of freedom
## Multiple R-squared: 0.09768, Adjusted R-squared: 0.0963
## F-statistic: 70.69 on 2 and 1306 DF, p-value: < 2.2e-1611.2 Assess the following with a linear probability model: did being a women or child (under 17) affected survival? Did boarding location (a rough proxy for country of origin) affect survival? Ireland is Queenstown (“Q”), France is Cherbourg (“C”) and the Englad is Southampton (“S”). Treat Southampton as the reference category. Control for age in your model.
## Creating Variables
dta$female <- (dta$sex == "female")
dta$child <- (dta$age < 17)
dta$Queensland <- (dta$embarked == "Q")
dta$Cherbourg <- (dta$embarked == "C")

## LPM Model
lpm_2 <- lm(survived ~ pclass_2 + pclass_3 + female + child +
              Queensland + Cherbourg + age, data = dta)

## Summary Output
summary(lpm_2)
##
## Call:
## lm(formula = survived ~ pclass_2 + pclass_3 + female + child +
## Queensland + Cherbourg + age, data = dta)
##
## Residuals:
## Min 1Q Median 3Q Max
## -1.06991 -0.23871 -0.07251 0.24266 1.02432
##
## Coefficients:
## Estimate Std. Error t value Pr(>|t|)
## (Intercept) 0.501995 0.054901 9.144 < 2e-16 ***
## pclass_2TRUE -0.161974 0.036697 -4.414 1.12e-05 ***
## pclass_3TRUE -0.316913 0.034512 -9.183 < 2e-16 ***
## femaleTRUE 0.488617 0.025487 19.171 < 2e-16 ***
## childTRUE 0.086800 0.044482 1.951 0.051283 .
## QueenslandTRUE -0.100586 0.057468 -1.750 0.080365 .
## CherbourgTRUE 0.113481 0.032477 3.494 0.000496 ***
## age -0.003752 0.001120 -3.351 0.000833 ***
## ---
## Signif. codes: 0 '***' 0.001 '**' 0.01 '*' 0.05 '.' 0.1 ' ' 1
##
## Residual standard error: 0.3881 on 1038 degrees of freedom
## (263 observations deleted due to missingness)
## Multiple R-squared: 0.3812, Adjusted R-squared: 0.3771
## F-statistic: 91.36 on 7 and 1038 DF, p-value: < 2.2e-1611.3 For the model from above, what are the minimum and maximum predicted probabilities of survival?
## Finding Min and Max
results_pred <- predict(lpm_2)
max(results_pred)
## [1] 1.130856min(results_pred)## [1] -0.180042811.4 What is the name, age, gender and passenger class of the person with the lowest probability of surviving? First, though, make a prediction about the gender, age, and class of the this person.
## Extract the "ID" of individual with minimum survival probability
id <- names(results_pred[results_pred == min(results_pred)])

## Look up the person from the original data
dta$name[as.numeric(id)]   # name
## [1] "Connors, Mr. Patrick"dta$age[as.numeric(id)] # age## [1] 70.5dta$sex[as.numeric(id)] # gender## [1] "male"dta$pclass[as.numeric(id)] # passenger class## [1] 311.5 What is the name of the person with the highest probability of surviving? As above, make a prediction about the gender, age, and class of the this person.
## Same as above but now for min
id_1 <- names(results_pred[results_pred == max(results_pred)])

dta$name[as.numeric(id_1)]   # name
## [1] "Hippach, Miss. Jean Gertrude"dta$age[as.numeric(id_1)] # age## [1] 16dta$sex[as.numeric(id_1)] # gender## [1] "female"dta$pclass[as.numeric(id_1)] # class## [1] 111.6 Estimate a probit and logit model where survival is a function of (only) passenger class. Treat passenger class as a nominal variable. Compare statistical significance to a similar LPM model. Can we easily interpret these coefficients?
## Probit Model
prob_1 <- glm(survived ~ pclass_2 + pclass_3, data = dta,
                family = binomial(link = "probit"))
summary(prob_1)
##
## Call:
## glm(formula = survived ~ pclass_2 + pclass_3, family = binomial(link = "probit"),
## data = dta)
##
## Deviance Residuals:
## Min 1Q Median 3Q Max
## -1.3896 -0.7678 -0.7678 0.9791 1.6525
##
## Coefficients:
## Estimate Std. Error z value Pr(>|z|)
## (Intercept) 0.30337 0.07092 4.278 1.89e-05 ***
## pclass_2TRUE -0.48075 0.10375 -4.634 3.59e-06 ***
## pclass_3TRUE -0.96130 0.08733 -11.008 < 2e-16 ***
## ---
## Signif. codes: 0 '***' 0.001 '**' 0.01 '*' 0.05 '.' 0.1 ' ' 1
##
## (Dispersion parameter for binomial family taken to be 1)
##
## Null deviance: 1741.0 on 1308 degrees of freedom
## Residual deviance: 1613.3 on 1306 degrees of freedom
## AIC: 1619.3
##
## Number of Fisher Scoring iterations: 4## Logit Model
logit_1 <- glm(survived ~ pclass_2 + pclass_3, data = dta,
family = binomial(link = "logit"))
summary(logit_1)##
## Call:
## glm(formula = survived ~ pclass_2 + pclass_3, family = binomial(link = "logit"),
## data = dta)
##
## Deviance Residuals:
## Min 1Q Median 3Q Max
## -1.3896 -0.7678 -0.7678 0.9791 1.6525
##
## Coefficients:
## Estimate Std. Error z value Pr(>|z|)
## (Intercept) 0.4861 0.1146 4.242 2.21e-05 ***
## pclass_2TRUE -0.7696 0.1669 -4.611 4.02e-06 ***
## pclass_3TRUE -1.5567 0.1433 -10.860 < 2e-16 ***
## ---
## Signif. codes: 0 '***' 0.001 '**' 0.01 '*' 0.05 '.' 0.1 ' ' 1
##
## (Dispersion parameter for binomial family taken to be 1)
##
## Null deviance: 1741.0 on 1308 degrees of freedom
## Residual deviance: 1613.3 on 1306 degrees of freedom
## AIC: 1619.3
##
## Number of Fisher Scoring iterations: 411.7 Estimate a probit and logit model where survival is a function of passenger class (treated as a nominal variable) age, gender, child and embarkation location. What is the minimum and maximum fitted value?
## Probit Model
prob_2 <- glm(survived ~ pclass_2 + pclass_3 + age + female + child + Queensland + Cherbourg,
              data = dta, family = binomial(link = "probit"))
summary(prob_2)
##
## Call:
## glm(formula = survived ~ pclass_2 + pclass_3 + age + female +
## child + Queensland + Cherbourg, family = binomial(link = "probit"),
## data = dta)
##
## Deviance Residuals:
## Min 1Q Median 3Q Max
## -2.6691 -0.6959 -0.4243 0.6807 2.5221
##
## Coefficients:
## Estimate Std. Error z value Pr(>|z|)
## (Intercept) 0.202305 0.211190 0.958 0.338098
## pclass_2TRUE -0.587322 0.137707 -4.265 2e-05 ***
## pclass_3TRUE -1.118932 0.133242 -8.398 < 2e-16 ***
## age -0.014960 0.004426 -3.380 0.000725 ***
## femaleTRUE 1.501844 0.095523 15.722 < 2e-16 ***
## childTRUE 0.230958 0.168719 1.369 0.171032
## QueenslandTRUE -0.382351 0.228617 -1.672 0.094435 .
## CherbourgTRUE 0.412361 0.122014 3.380 0.000726 ***
## ---
## Signif. codes: 0 '***' 0.001 '**' 0.01 '*' 0.05 '.' 0.1 ' ' 1
##
## (Dispersion parameter for binomial family taken to be 1)
##
## Null deviance: 1414.6 on 1045 degrees of freedom
## Residual deviance: 967.1 on 1038 degrees of freedom
## (263 observations deleted due to missingness)
## AIC: 983.1
##
## Number of Fisher Scoring iterations: 5## Logit Model
logit_2 <- glm(survived ~ pclass_2 + pclass_3 + age + female + child + Queensland + Cherbourg,
data = dta, family = binomial(link = "logit"))
summary(logit_2)##
## Call:
## glm(formula = survived ~ pclass_2 + pclass_3 + age + female +
## child + Queensland + Cherbourg, family = binomial(link = "logit"),
## data = dta)
##
## Deviance Residuals:
## Min 1Q Median 3Q Max
## -2.5906 -0.6866 -0.4178 0.6665 2.4766
##
## Coefficients:
## Estimate Std. Error z value Pr(>|z|)
## (Intercept) 0.354412 0.366136 0.968 0.333054
## pclass_2TRUE -0.982803 0.239313 -4.107 4.01e-05 ***
## pclass_3TRUE -1.974766 0.236301 -8.357 < 2e-16 ***
## age -0.025803 0.007764 -3.323 0.000889 ***
## femaleTRUE 2.538629 0.170096 14.925 < 2e-16 ***
## childTRUE 0.478567 0.295537 1.619 0.105379
## QueenslandTRUE -0.650478 0.393836 -1.652 0.098607 .
## CherbourgTRUE 0.703670 0.212002 3.319 0.000903 ***
## ---
## Signif. codes: 0 '***' 0.001 '**' 0.01 '*' 0.05 '.' 0.1 ' ' 1
##
## (Dispersion parameter for binomial family taken to be 1)
##
## Null deviance: 1414.6 on 1045 degrees of freedom
## Residual deviance: 964.5 on 1038 degrees of freedom
## (263 observations deleted due to missingness)
## AIC: 980.5
##
## Number of Fisher Scoring iterations: 4## Compute predicted probabilities
prob_pred <- predict(prob_2, type = "response")
max(prob_pred)## [1] 0.9824895min(prob_pred)## [1] 0.009295578## For the logit model
logit_pred <- predict(logit_2, type = "response")
max(logit_pred)## [1] 0.9749725min(logit_pred)## [1] 0.0164647811.8 What is the name of the person with the lowest probability of surviving? Use the probit model results from (g).
## Finding the Name and other demographic factors
id_2 <- names(prob_pred[prob_pred == min(prob_pred)])
dta$name[as.numeric(id_2)]
## [1] "Connors, Mr. Patrick"dta$pclass[as.numeric(id_2)]## [1] 3dta$age[as.numeric(id_2)]## [1] 70.5dta$sex[as.numeric(id_2)]## [1] "male"11.9 For the probit model from part (g), what is the effect of growing one year older (for an adult)? (Do this “manually”, using the observed-value, discrete difference method described in the book/lecture.)
## Generate "P1" - the predicted values at actual values of X
p_1 <- pnorm(coef(prob_2)[1] + coef(prob_2)[2]*dta$pclass_2 + coef(prob_2)[3]*dta$pclass_3 + coef(prob_2)[4]*dta$age + coef(prob_2)[5]*dta$female + coef(prob_2)[6]*dta$child + coef(prob_2)[7]*dta$Queensland + coef(prob_2)[8]*dta$Cherbourg)

## Generate "P2" - the predicted values with age increased by 1
p_2 <- pnorm(coef(prob_2)[1] + coef(prob_2)[2] *dta$pclass_2 + coef(prob_2)[3]*dta$pclass_3 + coef(prob_2)[4]*(dta$age + 1) + coef(prob_2)[5]*dta$female + coef(prob_2)[6]*dta$child + coef(prob_2)[7]*dta$Queensland + coef(prob_2)[8]*dta$Cherbourg)

## Taking the Difference
diff_age <- p_2 - p_1

## Finding the Mean Difference
mean(diff_age, na.rm = T)
## [1] -0.00388068611.10 Compare the probit effect of age to the LPM effect of age in part (b)
They are basically the same.
11.11 What is the effect of the passenger class, female and child variables in the above probit model? Use the mfx package as described in the lecture. Compare the predicted effects of these variables in the probit and the logit models to the results in the LPM in part (b).
## Marginal Effects Approach

## Probt Model
probitmfx(prob_2, data = dta, atmean = FALSE)
## Call:
## probitmfx(formula = prob_2, data = dta, atmean = FALSE)
##
## Marginal Effects:
## dF/dx Std. Err. z P>|z|
## pclass_2TRUE -0.1447206 0.0314009 -4.6088 4.05e-06 ***
## pclass_3TRUE -0.3069759 0.0344924 -8.8998 < 2.2e-16 ***
## age -0.0038868 0.0011353 -3.4238 0.0006176 ***
## femaleTRUE 0.4886939 0.0280493 17.4227 < 2.2e-16 ***
## childTRUE 0.0613860 0.0456767 1.3439 0.1789729
## QueenslandTRUE -0.0953979 0.0542356 -1.7590 0.0785852 .
## CherbourgTRUE 0.1122969 0.0342715 3.2767 0.0010503 **
## ---
## Signif. codes: 0 '***' 0.001 '**' 0.01 '*' 0.05 '.' 0.1 ' ' 1
##
## dF/dx is for discrete change for the following variables:
##
## [1] "pclass_2TRUE" "pclass_3TRUE" "femaleTRUE" "childTRUE" "QueenslandTRUE" "CherbourgTRUE"## Logit Model
logitmfx(logit_2, data = dta, atmean = FALSE)## Call:
## logitmfx(formula = logit_2, data = dta, atmean = FALSE)
##
## Marginal Effects:
## dF/dx Std. Err. z P>|z|
## pclass_2TRUE -0.1388455 0.0313257 -4.4323 9.322e-06 ***
## pclass_3TRUE -0.3121488 0.0348844 -8.9481 < 2.2e-16 ***
## age -0.0038246 0.0011913 -3.2105 0.001325 **
## femaleTRUE 0.4863850 0.0280803 17.3212 < 2.2e-16 ***
## childTRUE 0.0730217 0.0461283 1.5830 0.113419
## QueenslandTRUE -0.0925938 0.0533558 -1.7354 0.082670 .
## CherbourgTRUE 0.1094898 0.0340389 3.2166 0.001297 **
## ---
## Signif. codes: 0 '***' 0.001 '**' 0.01 '*' 0.05 '.' 0.1 ' ' 1
##
## dF/dx is for discrete change for the following variables:
##
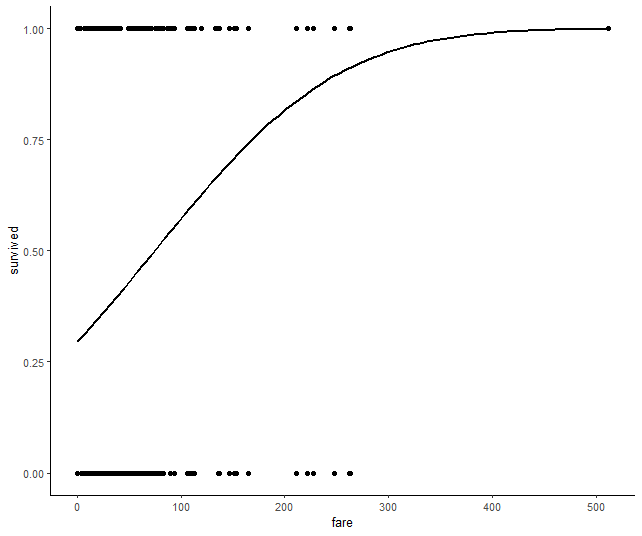
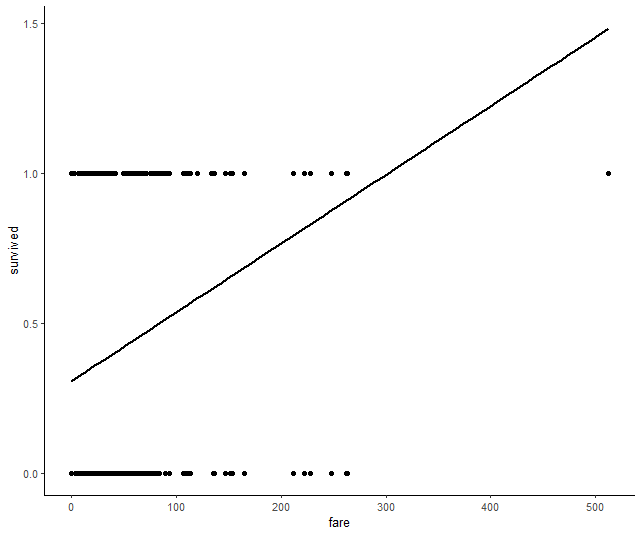
## [1] "pclass_2TRUE" "pclass_3TRUE" "femaleTRUE" "childTRUE" "QueenslandTRUE" "CherbourgTRUE"11.12 Use library(ggplot2) to create a logit/probit curve depicting the relationship between the cost of the fare and survivability. Compare this with a plot of the LPM.
## Logit Plot
dta %>%
  ggplot(aes(x = fare, y = survived)) +
  geom_point() +
  stat_smooth(method = "glm", se = FALSE, color = "black",
              method.args = list(family=binomial(link = "probit"))) +
  theme_classic()
## LPM Plot
dta %>%
  ggplot(aes(x = fare, y = survived)) +
  geom_point() +
  stat_smooth(method = "lm", se = FALSE, color = "black") +
  theme_classic()